grannules#
A package for predicting granulation light variability parameters of red giant stars.
Red giant power spectra generally look like Figure 4 of de Assis Peralta et al. 2018 [1]:
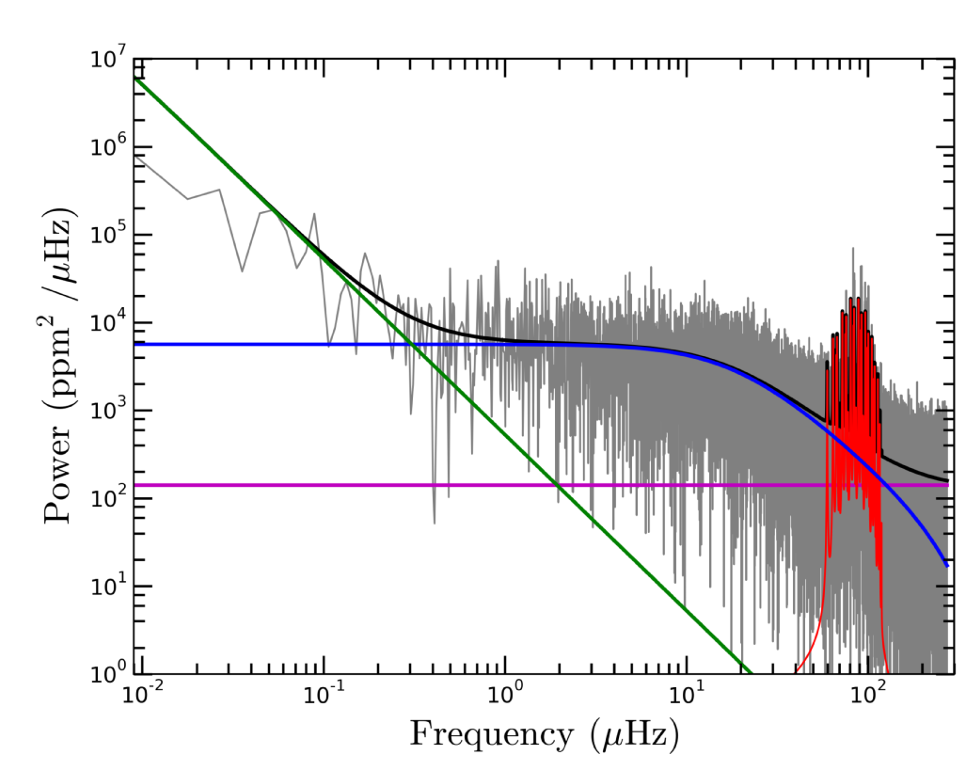
The blue curve represents the component of the spectrum originating from the granulation of the star. In other words, the light variability caused by the appearance and disappearance of “granules,” convection cells on the star’s photosphere. The red curve represents the component of the spectrum originating from stellar oscillations.
Red giant asteroseismologists usually focus on the signal received from the star, (the spikes of the red curve) whose properties have tight relations with the physical properties of the star. However, understanding the background components of these power spectra could also prove useful.
The granulation component is described by
and the overall shape of the oscillations component (ignoring the signal spikes) by a Gaussian function of the following form
where \(\tau\) is the timescale of granulation, and \(\delta \nu_\mathrm{env}\) is the FWHM of the gaussian, which we take to be \(\delta \nu_\mathrm{env} = 0.66 \nu_\mathrm{max}^{0.88}\) [1], [2]. \(H,\, P,\, \tau,\,\) and \(\alpha\) are usually fitted parameters. There exist scaling relations for these values, but they are not accurate enough for practical use [1].
This is where grannules comes in. This Python package is essentially a
wrapper around a neural network that, given a star’s mass, radius, temperature,
luminosity, and evolutionary phase, can predict that star’s background
parameters much more accurately than the existing scaling relations.